Chip-seq data analysis: from quality check to motif discovery and more
Lausanne, 27 March - 31 March 2017
Data reproduction exercise: ChIP-seq quality control - cross-correlation analysis
Sunil Kumar and Philipp Bucher
Introduction
Current exercise is baesd on the following paper:
Landt et al. 2012, ChIP-seq guidelines and practices of the ENCODE and modENCODE consortia. Genome Res. 22:1813-1831. PMID: 22955991.
The publication contain details of various good practices and guidelines followed by ENCODE and modENCODE consortia. One of the method called as 'cross-correlation analysis' deals with analyzing the quality of ChIP-seq experiment. In this exercise we will try to make a figure similar to the one from the paper (Figure 5).
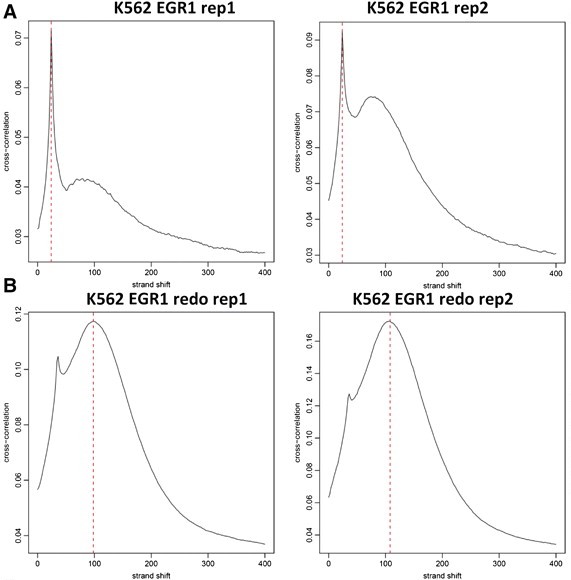
Quality control of ChIP-seq data sets in practice. EGR1 ChIP-seq was performed in K562 cells in two replicates. ChIP enriched regions were identified using MACS. However, the cross-correlation plot profiles (A) indicated that both experiments were suboptimal, with one being unacceptable. The ChIP-seq assays were repeated (B), with all quality control metrics improving significantly and many additional EGR1 peaks were identified as a result.
We will explore different datasets from the ChIP-seq server to assess their quality.
Cross-correlation analysis
A very useful ChIP-seq quality metric that is independent of peak calling is strand cross-correlation. It is based on the fact that a high-quality ChIP-seq experiment produces significant clustering of enriched DNA sequence tags at locations bound by the protein of interest, and that the sequence tag density accumulates on forward and reverse strands centered around the binding site. The cross-correlation metric is computed as the Pearson's linear correlation between the Crick strand and the Watson strand, after shifting Watson by k base pairs. This typically produces two peaks when cross-correlation is plotted against the shift value: a peak of enrichment corresponding to the predominant fragment length and a peak corresponding to the read length (“phantom” peak).
The normalized ratio between the fragment-length cross-correlation peak and the background cross-correlation (normalized strand coefficient, NSC) and the ratio between the fragment-length peak and the read-length peak (relative strand correlation, RSC), are strong metrics for assessing signal-to-noise ratios in a ChIP-seq experiment. High-quality ChIP-seq data sets tend to have a larger fragment-length peak compared with the read-length peak, whereas failed ones and inputs have little or no such peak. Check the publication for more details.
Hints and recipes
We will explore different studies carried out by ENCODE or other ChIP-seq experiments to see the cross-correlation analysis between ChIP-seq experiments.
The exercise will be carried out using 'Feature Correlation Tool' of ChIP-Cor Anaylsis Module.
Example 1: Explore two different ENCODE studies for same transcription factor to assess the quality of experiment in both the cases.
- Dataset I: GEO Accession GSM803406
Reference data set: hg19; Wang et al., 2012, GM12878 - YY1 Rep1; +ve strand
Target data set: hg19; Wang et al., 2012, GM12878 - YY1 Rep1; -ve strand
Analysis parameters: -1000 - 1000; Window width: 10; Counts Cut-off value: 1
Dataset II: GEO Accession GSM935482
Reference data set: hg19; GSE32465, GM12878 - YY1 None; +ve strand
Target data set: hg19; GSE32465, GM12878 - YY1 None; -ve strand
Analysis parameters: -1000 - 1000; Window width: 10; Counts Cut-off value: 1
Compare results from the two expriments and observe the difference. You may also look at the GEO page for both the expriments to see more details on the antibody used and other experimental conditions.
Example 2: GEO series GSE11431. Mapping of transcription factor binding sites in mouse embryonic stem cells.
Reference data set: mm9; Chen 2008, ES cells, ES Smad1; +ve strand
Target data set: mm9; Chen 2008, ES cells, ES Smad1; -ve strand
Analysis parameters: -1000 - 1000; Window width: 10; Counts Cut-off value: 1
You may want to try out other datasets and feature to check their experimental quality.