One-to-n alignments
Command: compare-matrices -v 1 -mode matches -format1 transfac -file1 $RSAT/public_html/tmp/wwwrun/2013/01/11/peak-motifs.2013-01-11.110705_2013-01-11.110705_PdhmNx/results/discovered_motifs/positions_7nt_m1/peak-motifs_positions_7nt_m1.tf -format2 tf -file2 $RSAT/public_html/data/motif_databases/JASPAR/jaspar_core_vertebrates_2009_10.tf -mode matches -DR -uth offset_rank 1 -lth w 5 -lth Wr 0.3 -lth cor 0.75 -lth Ncor 0.4 -return matrix_name,matrix_id,cor,Ncor,logoDP,NIcor,NsEucl,SSD,NSW,match_rank,width,strand,offset,consensus,alignments_1ton -sort Ncor -o $RSAT/public_html/tmp/wwwrun/2013/01/11/peak-motifs.2013-01-11.110705_2013-01-11.110705_PdhmNx/results/discovered_motifs/positions_7nt_m1/peak-motifs_positions_7nt_m1_vs_db_jaspar_core_vertebrates
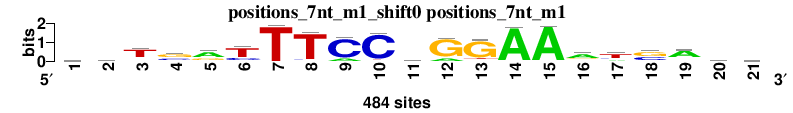
One-to-n matrix alignment; reference matrix: positions_7nt_m1_shift0 ; 4 matrices ; sort_field=rank_mean
| Matrix name | Aligned logos | cor |
Ncor |
logoDP |
NIcor |
NsEucl |
SSD |
NSW |
rcor |
rNcor |
rlogoDP |
rNIcor |
rNsEucl |
rSSD |
rNSW |
rank_mean |
match_rank |
Aligned matrices |
|---|
| positions_7nt_m1_shift0 (positions_7nt_m1) |
 |
|
|
|
|
|
|
|
|
|
|
|
|
|
|
|
|
; positions_7nt_m1; m=0 (reference); ncol1=21; shift=0; ncol=21; wsTsrTTTCCwGGAAatsAsa
; Alignment reference
a	124	107	52	35	289	18	1	4	77	11	153	80	33	472	477	287	85	17	330	114	138
c	117	138	39	167	31	113	2	28	401	442	92	2	4	8	3	30	87	196	57	143	117
g	112	148	53	247	137	19	2	6	2	3	97	395	400	2	2	105	23	244	51	131	113
t	131	91	340	35	27	334	479	446	4	28	142	7	47	2	2	62	289	27	46	96	116
|
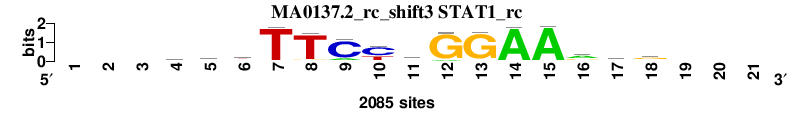
| MA0137.2_rc_shift3 (STAT1_rc) |
 |
0.945 |
0.675 |
7.824 |
0.676 |
0.963 |
0.625 |
0.979 |
2 |
1 |
1 |
1 |
1 |
2 |
1 |
1.286 |
1 |
; positions_7nt_m1 versus MA0137.2_rc (STAT1_rc); m=1/3; ncol2=15; w=15; offset=3; strand=R; shift=3; score= 1.2857; ---gryTTCydGGAArtg---
; cor=0.945; Ncor=0.675; logoDP=7.824; NIcor=0.676; NsEucl=0.963; SSD=0.625; NSW=0.979; rcor=2; rNcor=1; rlogoDP=1; rNIcor=1; rNsEucl=1; rSSD=2; rNSW=1; rank_mean=1.286; match_rank=1
a	0	0	0	431	714	315	15	32	302	66	680	155	44	2023	2038	1112	446	378	0	0	0
c	0	0	0	425	270	552	23	29	1700	1292	115	7	14	38	11	144	279	415	0	0	0
g	0	0	0	804	760	263	17	124	30	31	762	1900	1921	14	22	574	496	1076	0	0	0
t	0	0	0	417	336	954	2030	1900	53	696	528	23	106	8	10	251	859	208	0	0	0
|
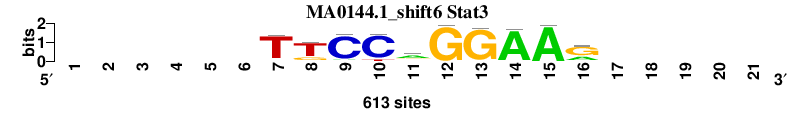
| MA0144.1_shift6 (Stat3) |
 |
0.948 |
0.451 |
7.793 |
0.447 |
0.948 |
0.531 |
0.973 |
1 |
2 |
2 |
2 |
2 |
1 |
2 |
1.714 |
2 |
; positions_7nt_m1 versus MA0144.1 (Stat3); m=2/3; ncol2=10; w=10; offset=6; strand=D; shift=6; score= 1.7143; ------TTCCaGGAAr-----
; cor=0.948; Ncor=0.451; logoDP=7.793; NIcor=0.447; NsEucl=0.948; SSD=0.531; NSW=0.973; rcor=1; rNcor=2; rlogoDP=2; rNIcor=2; rNsEucl=2; rSSD=1; rNSW=2; rank_mean=1.714; match_rank=2
a	0	0	0	0	0	0	20	13	38	6	321	8	6	585	606	191	0	0	0	0	0
c	0	0	0	0	0	0	19	10	552	541	21	0	2	21	1	15	0	0	0	0	0
g	0	0	0	0	0	0	25	129	9	1	148	605	592	7	5	393	0	0	0	0	0
t	0	0	0	0	0	0	549	461	14	65	123	0	13	0	1	14	0	0	0	0	0
|
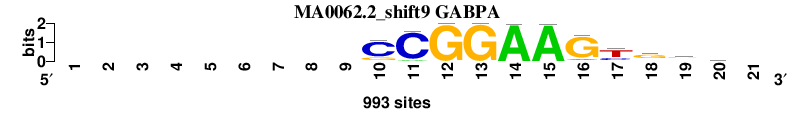
| MA0062.2_shift9 (GABPA) |
 |
0.778 |
0.408 |
5.981 |
0.399 |
0.909 |
2.004 |
0.909 |
3 |
3 |
3 |
3 |
3 |
3 |
3 |
3.000 |
3 |
; positions_7nt_m1 versus MA0062.2 (GABPA); m=3/3; ncol2=11; w=11; offset=9; strand=D; shift=9; score=      3; ---------CCGGAAGygvc-
; cor=0.778; Ncor=0.408; logoDP=5.981; NIcor=0.399; NsEucl=0.909; SSD=2.004; NSW=0.909; rcor=3; rNcor=3; rlogoDP=3; rNIcor=3; rNsEucl=3; rSSD=3; rNSW=3; rank_mean=3.000; match_rank=3
a	0	0	0	0	0	0	0	0	0	32	70	0	0	991	989	94	56	154	264	233	0
c	0	0	0	0	0	0	0	0	0	768	914	0	0	1	2	32	261	137	262	357	0
g	0	0	0	0	0	0	0	0	0	188	4	990	991	1	0	866	37	603	415	224	0
t	0	0	0	0	0	0	0	0	0	1	1	1	0	0	2	0	637	96	49	176	0
|