SSA User Manual
Introduction
Signals are short DNA sequences that tell the genomic apparatus where to initiate the process of genomic decoding (transcription, translation). Several signal sequences have been described in terms of their content consensus and positional distribution Examples are TATA box, CAAT box in prokaryotes and the cap signal in eukaryotes. The Signal Search Analysis (SSA) server can be used to study the characteristics of these control or signal sequences.
The server hosts two main programs for this type of analysis:
These programs can be used for the analysis of DNA sequences that are postionally correlated, there by look for known or unknown genetic signals.
Methodology
A typical signal search analysis pipeline involves the following steps:
- A set of fixed length DNA sequence segments defined by their location relative to an experimentally determined functional site (could be translation intiation site, transcription intiation site etc.) is extracted from a data library and organised as a matrix of nucleotides.
- This matrix is subdivided into overlapping vertical windows which are searched for "signal sequences". Thereby, the lines where given signal sequences occur are counted in successive windows, a process which yields an integer number called "signal frequency" for each combination of window and signal sequence.
- The resulting "signal frequency matrix" is processed to final output for localization and characterisation of common sequence features.
- The final output results are:
Program Description
Generation of a Signal Occurrence Profile - OProf
Input Parameters
Seqeunce Input
The Input sequences are a list of positionally correlated DNA sequence library
which were constructed as described below.
EPD non-redundant dataset
The Eukaryotic Promoter Database is an annotated non-redundant collection
of eukaryotic POL II promoters, for which the transcription start site has been
determined experimentally. In EPD, a promoter is defined by a position reference
to a Genbank/EMBL sequence that defines the position of the TSS in the
corresponding entry. Each promoter is categorized as "single site"(class S),
"multiple sites"(class M) or "region"(class R) according to the degree of TSS
scattering observed in promoter mapping experiment. For promoters of the M and
R classes, the postion reference points to the center of the sequence interval
in which transcription intiation events are observed. A new class "unknown" (U)
was introduced for promoters from PRESTA database, for which there is no
information necessary for proper classfication. Very recently, enteries based
on DATA from DBTSS and from the MGC program have also been incorporated.
Human promoters from paper
This set consists of manually curated promoter set from literature, for which
the transcription start site has been determined experimentally.
Human promoters from DBTSS
This set is based on data from DBTSS(Suzuki et al.,2002), which provides cDNA
5'end profiles derived from cDNA librairies obtained with the oligo-capping
method. DBTSS is a gene centered resource where one entry corresponds to one
gene where as promoter-centered database like the EPD contain multiple enteries
for the same gene if there are alternative promoters. The DBTSS database was
converted to EPD-like database using the 5'end genomic co-ordinate of
each clone of DBTSS
Human promoters from PRESTA
PRESTA is the name of a program that extracts promoter sequences from
the nucleotide sequence databases. It scans the annotation parts of the
GenBank/EMBL sequence enteries for feature keys indicative of a TSS. For each
putative promoter collected in the first pass, the program attempts to find EST
5' end sequences matching the corresponding genomic regions. EST 5' ends
mapping closely to the annotated TSS are considered positive evidence.
We first downloaded a FASTA-formatted library containing all human promoters
from the PRESTA web site. The TSS positions were taken from the header lines of
this file. Stringent Blast searched were performed to match the retrieved
sequences to a genomic sequence entries from GenBank/EMBL and to an RNA
sequence from Refseq. The HUGO approved gene symbol was extracted from the
Refseq entry. All promoters were attributed to the newly introduced promoter
class "unknown"(U).
Human promoters from MGC
The goal of the MGC program is to generate a reference collection of
full length human and mouse cDNA clones. For this purpose, the 5' and 3' ends
of a large number of cDNA clones from full-length enriched libraries were
sequence and deposited as ESTs in GenBank/EMBL. The corresponding chromatograms
are available and we used these chromatograms to extract the sequences.
The begining of the cDNA insert was mapped to Genomic contigs via RefSeq
identifiers and the genomic sequences were extracted and complied.
E.coli translation intitation sites
This is a library that was extracted from the E.coli
genome sequences.
B.subtilis translation intiation sites
This is a library that was extracted from the B.subtilis genome sequences.
3' and 5' borders
The left and the right end borders are intergers which define the
horizontal extension for the length of the DNA to be extracted from a data
library.
Search Parameters
Window size and shift
The fixed length (as determined by the 5' and 3' borders) sequences extracted from the data library are organised into as a matrix of oligonucleotides. This matrix is divided into cross-sections or windows. Two parameters define this sub-division process:
- Window length - the number of bases into which the matrix is to be divided.
- Window displacement length - the number of bases by which the window is displaced rightwards with respect to the preceeding one.
Search mode
This parameter presents the strand of DNA to be searched for. If a
signal is specified bidirectional, in which case the complementary strands of
the Window segments are also considered.
Notes:
Eukarotic promoters are known to occur only in the forward direction or
in both orientations. The promoter occuring in both the orientiations can direct
the expression of two genes, one on each end of the promoter. For example, CCAAT and
GC-boxes are bidirectional elements whereas the TATA-box and Initiator are
unidirectional elements.
Signal description
The signals can be described in two different formats
- Consensus sequence - which indicate the predominant nucleotide at each position of the signal sequence.
- Weight matrix - a two dimensional table containing the frequency of each nucleotide at each position of the motif. For example see the default matrix for TATA box printed on the OProf web site
A signal library has also been provided. The following promoters are available in the signal library:
- TATA Box
- GC Box
- CAAT box
- Initiator Element
Reference Position The reference position indicates the nucleotide position within the consensus signal or the PWM that describes the motif.
Cut-off Value
The Weight matrix can be used to compute a score for any subsequence of the corresponding length in a promoter region. The cut-off value determines which subsequence represents a match to the motif.
Program Output
The OUTPUT consists of two parts:
- The input parameters are printed
- A graphical representation of the positional representation of the signal sequence.
- An example output of the positional distribution of TATA-boxes within the EPD promoter data set is shown here:
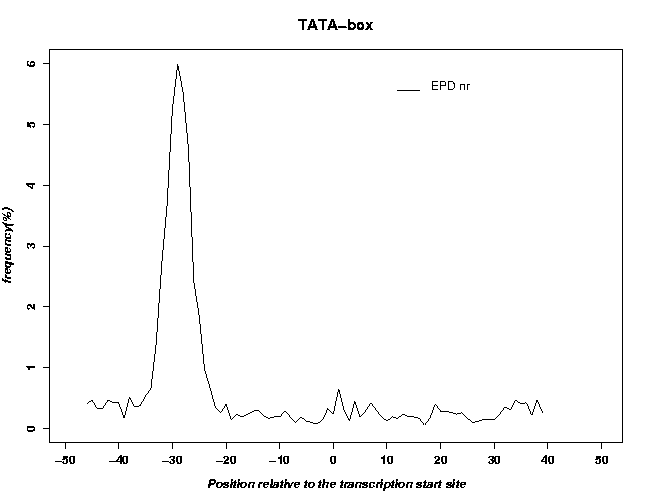
It can be seen that the EPD is enriched in TATA-box containing promoters.
Generation of a Signal List - SList
Input Parameters
Sequence Input The Input sequences are a list of positionally correlated DNA sequence library which were constructed as described below. The datasets available are the same as that for the OProf.
Sequence Parameters and Search parameters
These parameters are also the same as described above for the OProf.
Selection criteria:
Five different Signal selection Criteria has to be provided by the user
- Occurrence frequency: This Criteria allows users to look for both over and under represented signal sequences in the data set.
- Calculation mode:
- Selection mode: This parameter determines which subsequences will be considered. The parameters are:
- If "global maxima/minima" is specified unique global best fits are selected.
- If "local maxima.minima" is specified each canditate motif that is not overlapped by an equal or better match is selected
- If "all" is specified all occurrences are processed
- St-dev cut-off: A Standard deviation for the signal frequencies of all the signals either over represented or under represented in the DNA sequence matrix is calculated and this parameter sets the cut-off for the standard deviation for the signals to be selected
- Sort list by: This criteria allows the user to sort the list of signals that over or under represented by either the position or by the standard deviation of the signals.
Signal collection
A Signal sequence collection is required to look at the over or under
represented signals in the data set
The program offers three different possibility of choosing a signal sequence collection
- A complete signal sequence collection contains all possible sequence of a "signal sequence length"
- A random signal sequence collection contains random number of signal sequences of specified number and length.
- If special option is specified then gapped oligonucleotides are used as signal sequences. Gapped oligonucleotides are signal sequences in which distinct positions are unspecified. These positions are represented by an additional character (hyphen or N) which plays the role of a wild card. Also, the explicitly specified nucleotides must be centered so that the number of leading N's is either equal to the number of trailing N's or lower by one in order to avoid multiples of equivalent signal sequences such as ANANNN,NANANN etc. For example the default web page of the SLIST program consists of gapped dinucleotide collection of total length 6.
Program Output
The OUTPUT of the program consists of two parts:
- The Input parameters specified by the user is seen on the first half of the page
- The second half consists of the signal list that were either over or under represented (as per the specifications of the user) along with columns of the respective signal freqeuncy and standard deviations.
- A sample of the output is shown below for TATA-box signals within the EPD promoter data set:
